CMRE-PC
CMRE-PC
Costamare Inc.Income Statement
| Period | Revenue | Operating Expense | Net Income | Net Profit Margin | Earnings Per Share | EBITDA |
|---|---|---|---|---|---|---|
| Q1-2026 | $201.56M ▼ | $15M ▲ | $80.4M ▲ | 39.89% ▲ | $0.62 ▲ | $139.16M ▲ |
| Q4-2025 | $211.97M ▼ | $13.36M ▼ | $77.84M ▼ | 36.72% ▼ | $0.6 ▼ | $135.48M ▼ |
| Q3-2025 | $225.17M ▲ | $44.26M ▲ | $97.91M ▲ | 43.48% ▲ | $0.77 ▲ | $138.65M ▼ |
| Q2-2025 | $210.9M ▼ | $11.53M ▼ | $88.69M ▼ | 42.06% ▲ | $0.69 ▼ | $165.11M ▲ |
| Q1-2025 | $446.23M | $27.4M | $100.13M | 22.44% | $0.79 | $153.93M |
Balance Statement
| Period | Cash & Short-term | Total Assets | Total Liabilities | Total Equity |
|---|---|---|---|---|
| Q1-2026 | $602.26M ▲ | $3.92B ▲ | $1.7B ▼ | $2.15B ▲ |
| Q4-2025 | $547.25M ▲ | $3.86B ▲ | $1.7B ▼ | $2.09B ▲ |
| Q3-2025 | $525.26M ▲ | $3.86B ▲ | $1.76B ▲ | $2.03B ▲ |
| Q2-2025 | $510.67M ▼ | $3.74B ▼ | $1.72B ▼ | $1.95B ▼ |
| Q1-2025 | $818.8M | $5.13B | $2.48B | $2.59B |
Cash Flow Statement
| Period | Net Income | Cash From Operations | Cash From Investing | Cash From Financing | Net Change | Free Cash Flow |
|---|---|---|---|---|---|---|
| Q1-2026 | $81.9M ▲ | $112.4M ▼ | $-14.61M ▲ | $-43.08M ▲ | $54.7M ▲ | $25.49M ▼ |
| Q4-2025 | $79.15M ▼ | $118.05M ▼ | $-26.67M ▲ | $-90.67M ▼ | $713K ▼ | $66.16M ▲ |
| Q3-2025 | $99.35M ▼ | $135.62M ▲ | $-44.5M ▼ | $-27.14M ▼ | $63.98M ▲ | $30.94M ▲ |
| Q2-2025 | $105.16M ▲ | $-142.79M ▼ | $-1.59M ▼ | $54.04M ▲ | $-350.94M ▼ | $7.79M ▼ |
| Q1-2025 | $100.84M | $143.08M | $1.48M | $-54.44M | $90.12M | $137.28M |
Q4 2025 Earnings Call Summary
Read Call Summary5-Year Trend Analysis
A comprehensive look at Costamare Inc.'s financial evolution and strategic trajectory over the past five years.
Costamare combines historically strong profitability with a now more conservative balance sheet and solid liquidity. Its long‑term charter strategy provides visibility into future cash flows, and the company has shown it can generate robust operating cash and, in normal investment years, healthy free cash. Deleveraging in recent years has lowered financial risk, while the Neptune Maritime Leasing platform offers an additional, diversified earnings stream built on the firm’s deep shipping expertise. The spin‑off of the dry bulk business sharpened its strategic focus on containerships and leasing.
Key risks center on the sharp recent drop in revenue and the step down in assets and retained earnings, which point to a business that is adjusting to a cooler market and a smaller footprint. Earnings have moved off their peak, margins have been volatile, and cash flows are sensitive to large, episodic capital programs. As a cyclical, asset‑heavy ship owner, the company remains exposed to swings in global trade, charter renewals at less favorable rates, regulatory demands for cleaner fleets, rising operating costs, and competition from other owners and lessors. Any misstep in timing major investments could strain free cash flow again.
The company appears to be entering a more disciplined phase: leaner, less levered, and focused on extracting value from a contracted containership fleet and a growing leasing arm. If it can maintain strong charter coverage, continue prudent capital allocation, and navigate environmental and regulatory changes without overextending on newbuilds, its financial profile could remain solid even in a normalized shipping environment. For observers of CMRE‑PC, the key variables going forward are the durability of operating cash generation, the stability of the charter backlog, and management’s willingness to preserve the now stronger balance sheet through the next turns of the shipping cycle.
About Costamare Inc.
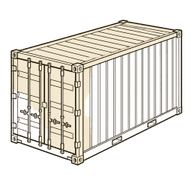
https://www.costamare.comCostamare Inc. is a global maritime transport firm primarily engaged in the ownership and leasing of container vessels to international shipping lines. As of March 18, 2022, its extensive fleet included 76 containerships with an approximate combined capacity of 557,400 twenty-foot equivalent units (TEUs).
Income Statement
| Period | Revenue | Operating Expense | Net Income | Net Profit Margin | Earnings Per Share | EBITDA |
|---|---|---|---|---|---|---|
| Q1-2026 | $201.56M ▼ | $15M ▲ | $80.4M ▲ | 39.89% ▲ | $0.62 ▲ | $139.16M ▲ |
| Q4-2025 | $211.97M ▼ | $13.36M ▼ | $77.84M ▼ | 36.72% ▼ | $0.6 ▼ | $135.48M ▼ |
| Q3-2025 | $225.17M ▲ | $44.26M ▲ | $97.91M ▲ | 43.48% ▲ | $0.77 ▲ | $138.65M ▼ |
| Q2-2025 | $210.9M ▼ | $11.53M ▼ | $88.69M ▼ | 42.06% ▲ | $0.69 ▼ | $165.11M ▲ |
| Q1-2025 | $446.23M | $27.4M | $100.13M | 22.44% | $0.79 | $153.93M |
Balance Statement
| Period | Cash & Short-term | Total Assets | Total Liabilities | Total Equity |
|---|---|---|---|---|
| Q1-2026 | $602.26M ▲ | $3.92B ▲ | $1.7B ▼ | $2.15B ▲ |
| Q4-2025 | $547.25M ▲ | $3.86B ▲ | $1.7B ▼ | $2.09B ▲ |
| Q3-2025 | $525.26M ▲ | $3.86B ▲ | $1.76B ▲ | $2.03B ▲ |
| Q2-2025 | $510.67M ▼ | $3.74B ▼ | $1.72B ▼ | $1.95B ▼ |
| Q1-2025 | $818.8M | $5.13B | $2.48B | $2.59B |
Cash Flow Statement
| Period | Net Income | Cash From Operations | Cash From Investing | Cash From Financing | Net Change | Free Cash Flow |
|---|---|---|---|---|---|---|
| Q1-2026 | $81.9M ▲ | $112.4M ▼ | $-14.61M ▲ | $-43.08M ▲ | $54.7M ▲ | $25.49M ▼ |
| Q4-2025 | $79.15M ▼ | $118.05M ▼ | $-26.67M ▲ | $-90.67M ▼ | $713K ▼ | $66.16M ▲ |
| Q3-2025 | $99.35M ▼ | $135.62M ▲ | $-44.5M ▼ | $-27.14M ▼ | $63.98M ▲ | $30.94M ▲ |
| Q2-2025 | $105.16M ▲ | $-142.79M ▼ | $-1.59M ▼ | $54.04M ▲ | $-350.94M ▼ | $7.79M ▼ |
| Q1-2025 | $100.84M | $143.08M | $1.48M | $-54.44M | $90.12M | $137.28M |
Q4 2025 Earnings Call Summary
Read Call Summary5-Year Trend Analysis
A comprehensive look at Costamare Inc.'s financial evolution and strategic trajectory over the past five years.
Costamare combines historically strong profitability with a now more conservative balance sheet and solid liquidity. Its long‑term charter strategy provides visibility into future cash flows, and the company has shown it can generate robust operating cash and, in normal investment years, healthy free cash. Deleveraging in recent years has lowered financial risk, while the Neptune Maritime Leasing platform offers an additional, diversified earnings stream built on the firm’s deep shipping expertise. The spin‑off of the dry bulk business sharpened its strategic focus on containerships and leasing.
Key risks center on the sharp recent drop in revenue and the step down in assets and retained earnings, which point to a business that is adjusting to a cooler market and a smaller footprint. Earnings have moved off their peak, margins have been volatile, and cash flows are sensitive to large, episodic capital programs. As a cyclical, asset‑heavy ship owner, the company remains exposed to swings in global trade, charter renewals at less favorable rates, regulatory demands for cleaner fleets, rising operating costs, and competition from other owners and lessors. Any misstep in timing major investments could strain free cash flow again.
The company appears to be entering a more disciplined phase: leaner, less levered, and focused on extracting value from a contracted containership fleet and a growing leasing arm. If it can maintain strong charter coverage, continue prudent capital allocation, and navigate environmental and regulatory changes without overextending on newbuilds, its financial profile could remain solid even in a normalized shipping environment. For observers of CMRE‑PC, the key variables going forward are the durability of operating cash generation, the stability of the charter backlog, and management’s willingness to preserve the now stronger balance sheet through the next turns of the shipping cycle.

CEO
Konstantinos V. Konstantakopoulos
Compensation Summary
(Year )
Upcoming Earnings
ETFs Holding This Stock
Summary
Showing Top 1 of 1
Ratings Snapshot
Rating : A-